Basically, The hearing is one of the vital sensations for human beings. It helps in analyzing the sound and can be comprehended with the brain. However, hearing loss is the ability to lose the capability of hearing. The quietest sounds a human can hear is between 25 to 40 decibel. Anyone who is suffering from mild hearing loss cannot able to hear normal conversations. Hearing loss can impact the life of an individual.
You can purchase the latest hearing aids at a fair price through HearingSol, If you need more information or you have a query about Hearing Aid or Hearing Loss, just give us a call on +91-9327901950. We are always here to help you.
What is an audiogram?
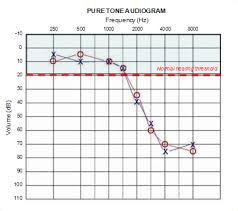
The audiogram is a type of graph on which the results of the hearing test are displayed. The audiogram shows the softest sounds that a person can hear at different pitches and frequencies. The softest sound that a man can hear is measured by the marks at the graph. Closer the mark to the top softer is the sound that a person can hear. The graph represents the fall of the patient’s test results in three different degrees of hearing loss.
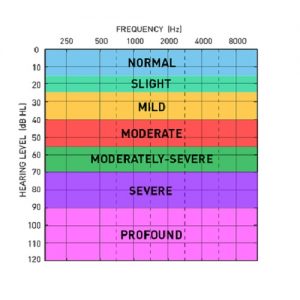
The figure of the audiogram below indicates the different degrees of hearing loss.
Classification of hearing loss on the basis of Audiogram depends on some factors
1. The shape which graphed out on the audiogram chart.
2. By Frequency
3. By the level of loss or seriousness at each frequency.
Because of complexity, these losses are divided into two parts. If the slope is going below 1000hz then its called low Hz’s and above 1000hz is known as High Hz’s.
Shape:-
Here we will explain about something regarding the graph.
- Flat:- 0-5 dB across all frequencies.
- Gradually:- Falling 5-10 dB for 1000+Hz(High Hertz)
- Reverse Slope Or Rising Curve:- Rising gradually at 5-10 dB for high Hz. At high frequency, the loss gets better.
- Marked Falling Curve:- Steady large drop in high Hz’s, 15-20 dB per octave. Not normal in lows.
- Sudden Drop:- Perpendicularly drop in high Hz’s only. Normal lows up to 1000Hz.
- Precipitous/SKi-Slope:- Start from flat or gradually sloping (5-10 DB per octave) then sharply slopes down.
The grading of hearing loss based on Audiogram is given below:-
- Normal
- The threshold is between 0-25 dB.
- It is the range of hearing ability of adults.
- Mild
- Threshold between 29-30db
- You may experiences difficulties speech in noisy environments.
- Moderate
- Threshold between 41-55db
- Experiences difficulties speech and quieter sound.
- Moderately Severe
- Between 56-70 DB
- Severe
- Threshold between 70-89db
- Experiences difficulties in understanding speech even you are in a quiet environment. Day to day noises becomes difficult to hear.
- Profound
- Threshold between 90db+
- The ability of hearing sound is very challenging.
Type of Hearing loss:-
1. Conductive:- Air-Bone Gap(ABG) of 10 dB or more.
2. Sensorineural:- No ABG more than the 15db loss. Air Condition scores are within 10-15 dB of the Bone Conduction score.
3. Mixed:- An ABG and Sensory neural loss.
Symmetry
Unilateral- suffering from hearing loss from only one ear
Bilateral- hearing loss in both the ears
Symmetrical- both ears same/similar hearing loss
Asymmetrical- different hearing loss in both the ears
So basically hearing loss depends on the basis of Severity.
How is audiogram measures hearing?
Sound volume or intensity is measured by the vertical axis of the audiogram. The degree of measuring in decibels (dB). The louder is the sound as the one moves down the axis. This is similar to the volume of a radio which is being turned up. The softest sound that a person can hear is represented by zero decibels at the top of the vertical axis. This indicates that you are normally able to hear and is not an indication that you cannot hear any sounds at all.
Sound frequency or pitch is represented by the horizontal axis of the audiogram. The degree of measuring in Hertz. As the one moves along the right of the x-axis then the frequency or pitch gradually increases. This movement is similar to playing on the left side of a piano and slowly starting to move towards the right side where the tone is more and more high-pitched. Frequencies between 500 Hz and 3000 Hz are best when we are doing ordinary communication.
Conclusion
If you are able to read the audiogram chart than it will be easy for you to know your hearing loss. However, if you do not know don`t worry about that. Your doctor will tell you each and everything about your report.
More information:
Top Deaf Influencers Who Changed the Perception of Hearing Loss
Sensorineural vs Conductive Hearing Loss – What Is The Difference?
Food Affecting Hearing Loss – 10 Nutrients to Boost Your Hearing